💾 Data!
Before we get our hands dirty, we need to answer one important question: What data do we need to build our feature?
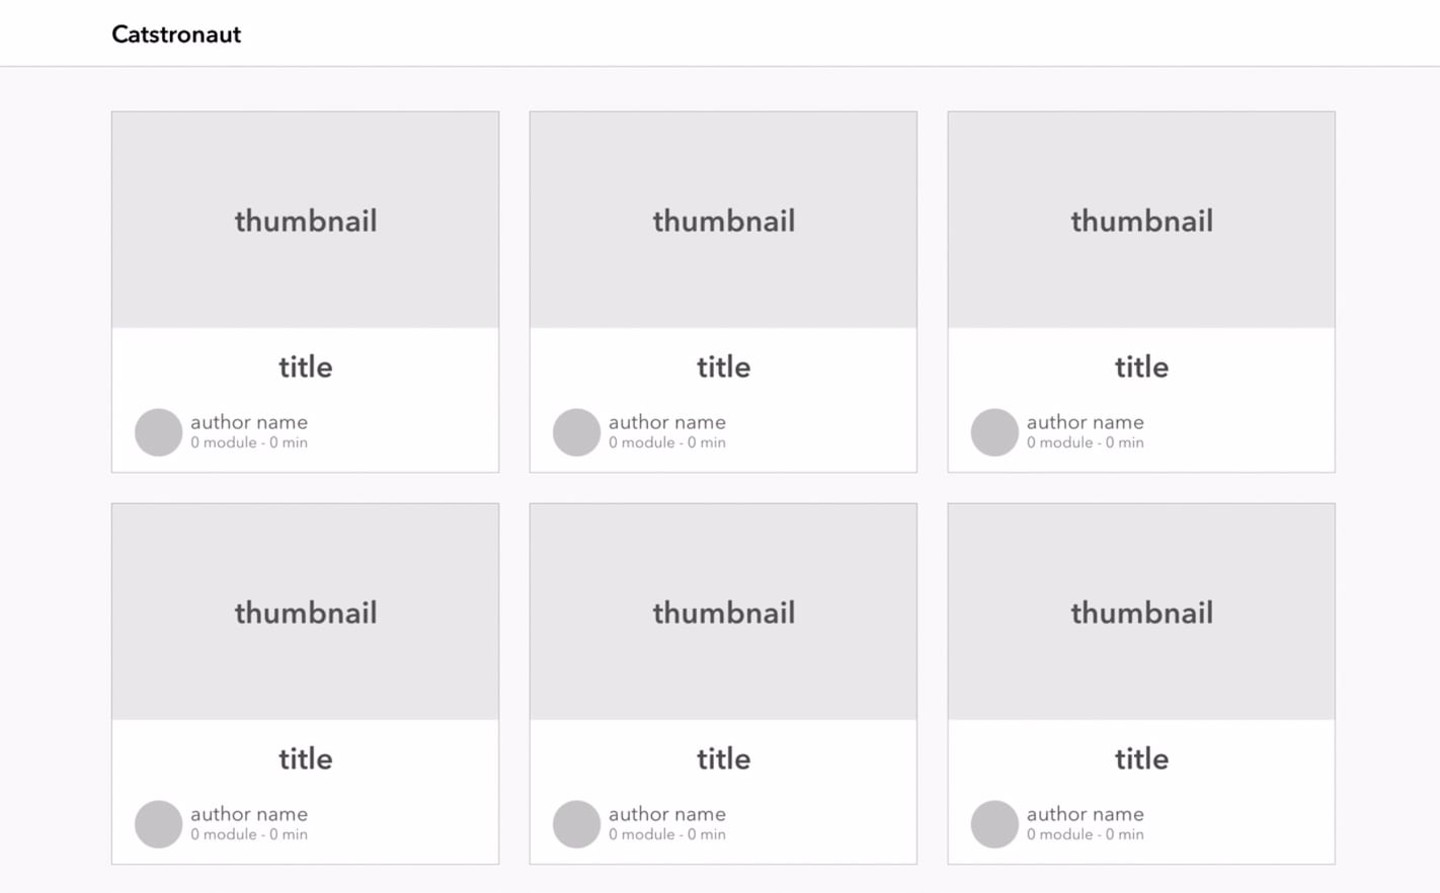
Let's take a look at the mockup our design team sketched for us. This is what the homepage should look like: a nice clean card grid.

Before you continue, take a moment to review the mockup and determine which information we'll probably need to populate a single card.
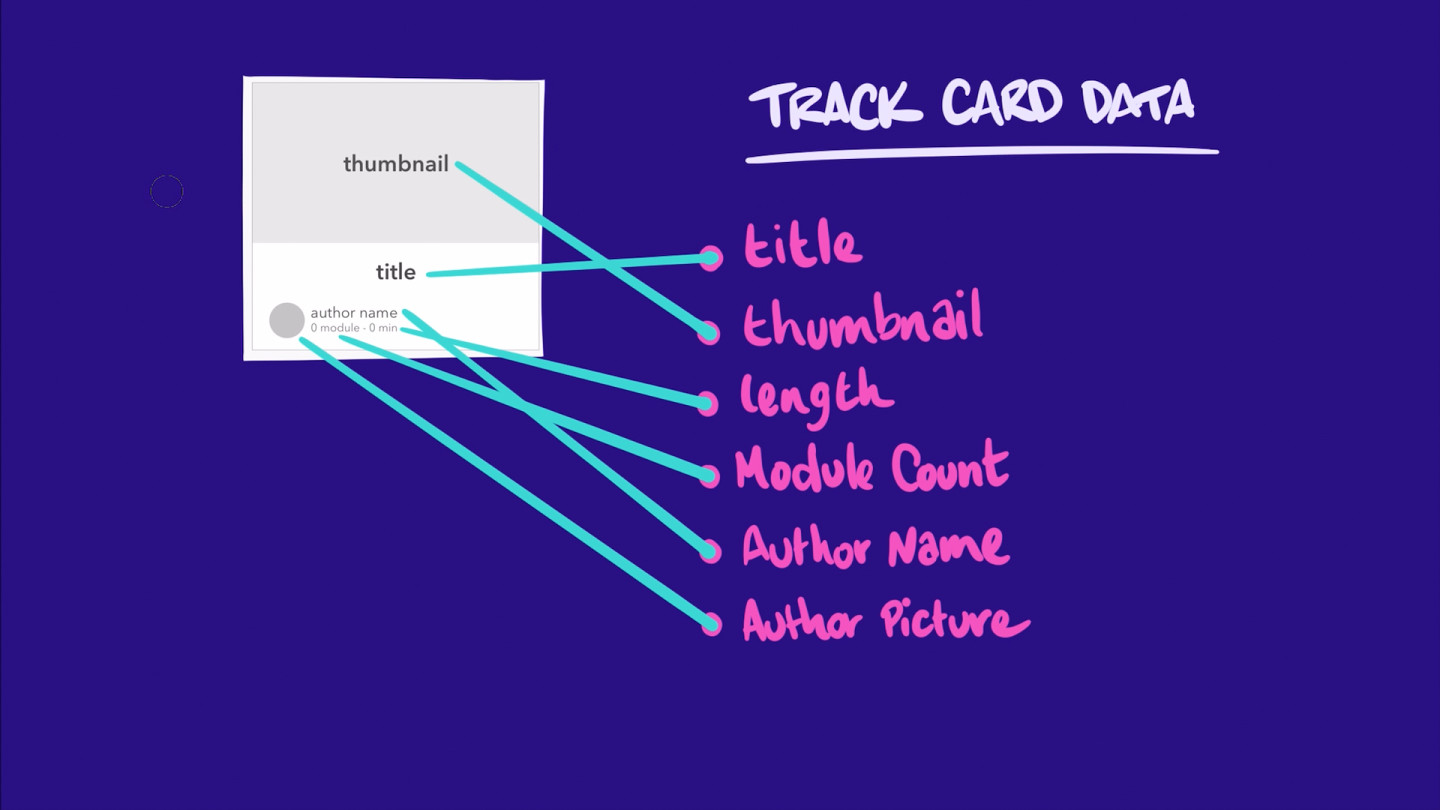
Based on the mockup, it looks like we'll need the following information for each learning track:
- Title
- Thumbnail image
- Length (estimated duration)
- Module count
- Author name
- Author picture

The graph
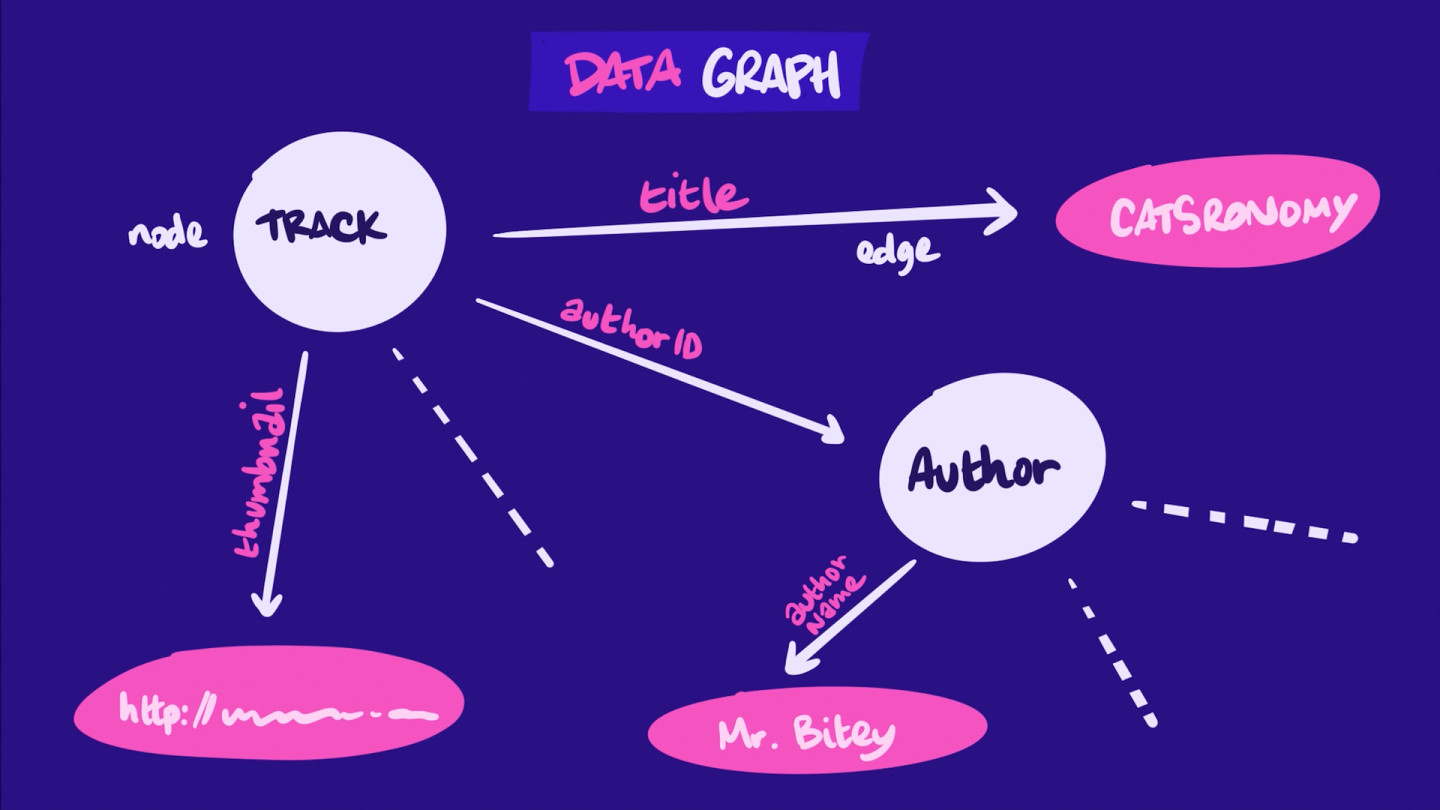
Looking at the list above, we can start to think about our app's data as a collection of objects (such as learning tracks and authors) and relationships between objects (such as each learning track having an author).
Now, if we think of each object as a node and each relationship as an edge between two nodes, we can think of our entire data model as a graph of nodes and edges. This is called our application's graph.
Here's an incomplete representation of our application's graph, based entirely on our mockup's data requirements:

Our job in the next couple lessons is to define this graph structure using a schema.
Share your questions and comments about this lesson
Your feedback helps us improve! If you're stuck or confused, let us know and we'll help you out. All comments are public and must follow the Apollo Code of Conduct. Note that comments that have been resolved or addressed may be removed.
You'll need a GitHub account to post below. Don't have one? Post in our Odyssey forum instead.