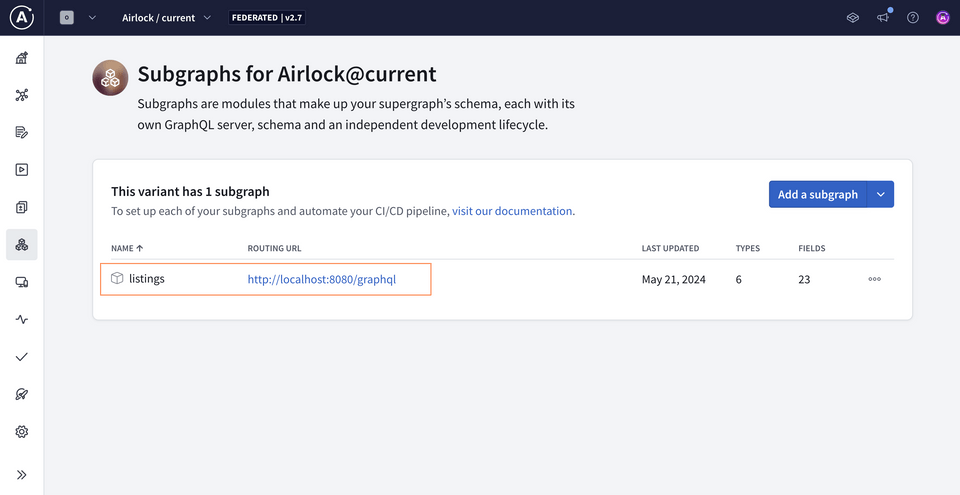
Overview
We've taken care of two of our steps on the journey from subgraph to supergraph. We've centralized a place in Studio for all of the details about our graph to live—but we're still missing the piece that routes different parts of our query to different services. Next up: let's get our router running!
In this lesson, we will:
- Set up the GraphOS Router locally
- Connect our router to GraphOS
- Send our first query to our supergraph
- Explore supergraph insights through the operation and field metrics provided by GraphOS
The GraphOS Router
The GraphOS Router is a high-performance graph router, available as an executable binary that you can configure in just a few steps.
Installing the router
Open up a new terminal window and navigate into the router directory.
So far, we have the .env file in here with our environment variables (APOLLO_GRAPH_REF and APOLLO_KEY), along with a file called router-config.yaml. This is a configuration file which lets us customize certain aspects about how the router runs.
📦 router┣ 📄 router-config.yaml┗ 📄 .env
We'll download the router by running the install command in the terminal.
curl -sSL https://router.apollo.dev/download/nix/v1.46.0 | sh
We'll see some installation output, then an instruction on how to start the router.
You can now run the Apollo Router using './router'
Note: Visit the official documentation to explore alternate methods of downloading the Router.
Now when we check the contents of our router directory, we'll see that we have a new file also called router!
📦 router┣ 📄 router-config.yaml┣ 📄 .env┗ 📄 router
Router configuration
Let's take a peek inside the router-config.yaml file. This file enables us to customize our router's behavior.
supergraph:listen: 127.0.0.1:5000include_subgraph_errors:all: truetelemetry:instrumentation:spans:mode: spec_compliant
For now, we've set a few options, including the port that the router should run on (under the supergraph.listen property). We also configured a setting to include all the subgraph errors that bubble up. By default, the router redacts the details of subgraph errors in its responses, and we might see an error message like "Subgraph errors redacted". In production environments, this property is usually set to false, but it'll be helpful if you run into any issues following along in this tutorial.
Lastly, we have some telemetry configuration which reduces the kinds of errors we'll see in our terminal output.
Note: To learn more about other options available for configuring the GraphOS Router, check out the documentation.
Running the router
Next up: we'll tell the router which supergraph to connect to, and how to authenticate to it.
For that, we'll use those two specific pieces of data we copied from the supergraph creation process: our APOLLO_KEY and APOLLO_GRAPH_REF values!
From a terminal in the router directory, run the command below that suits your development environment, replacing the placeholder <APOLLO_KEY> and <APOLLO_GRAPH_REF> with your values from .env.
APOLLO_KEY=<APOLLO_KEY> APOLLO_GRAPH_REF=<APOLLO_GRAPH_REF> ./router --config router-config.yaml
$env:APOLLO_KEY="<APOLLO_KEY>"$env:APOLLO_GRAPH_REF="<APOLLO_GRAPH_REF>"./router --config router-config.yaml
Notice the --config flag we're including in our command? This tells the router to use the settings we've included in router-config.yaml.
We'll see a few lines of router output, and finally a message that our router is running on port 5000, ready to receive queries!
Let's copy this address.
http://127.0.0.1:5000/
This is the entrance to our graph: if this were a production URL, it's where anyone querying any part of our schema would send their requests to! For this course, we'll keep our router running locally on port 5000—so let's add this detail to GraphOS!
Connecting the router to GraphOS
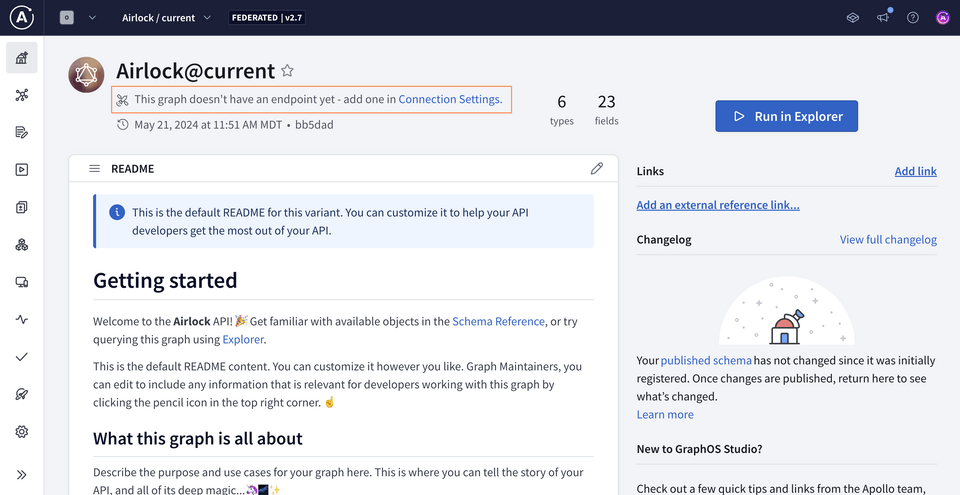
Flipping back over to Studio, click on the README tab in the sidebar. Next, tap the Connection Settings link at the top of the page.
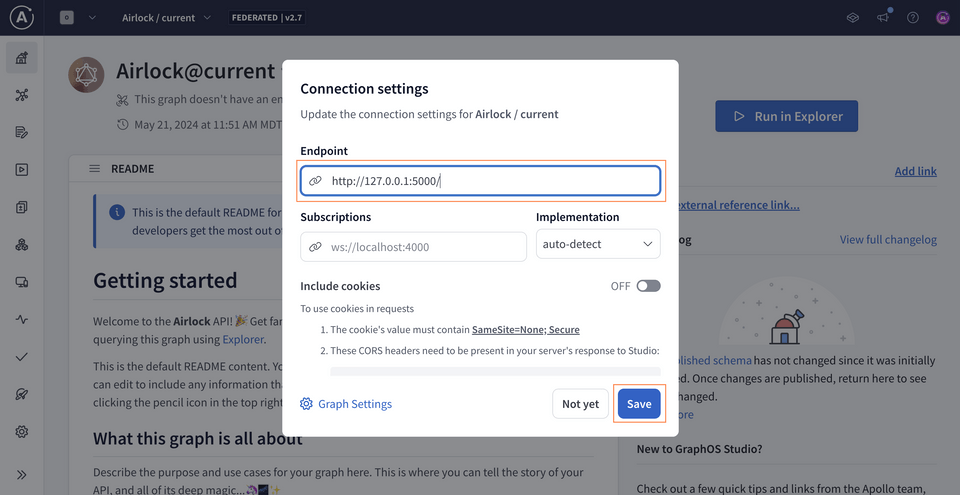
We'll paste the router address we copied (http://127.0.0.1:5000) as the endpoint, then save.
Testing our schema
Let's put together a query that retrieves the titles and descriptions of our featured listings. Select the Explorer tab from the sidebar and paste in the following operation.
query GetFeaturedListings {featuredListings {idtitledescription}}
Now let's run this query, and... fantastic! We've got data!
Though our router and listings subgraph are running locally, we've got all the pieces in place for production!
GraphOS provides us with observability tools to monitor the health and performance of our supergraph. These tools help surface patterns in how our supergraph gets used, which helps us continue to improve it. We're still in tutorial-land, so there isn't any real production traffic going to our supergraph, but we can still check out our supergraph insights.
Operation metrics
Let's navigate over to the Insights page.
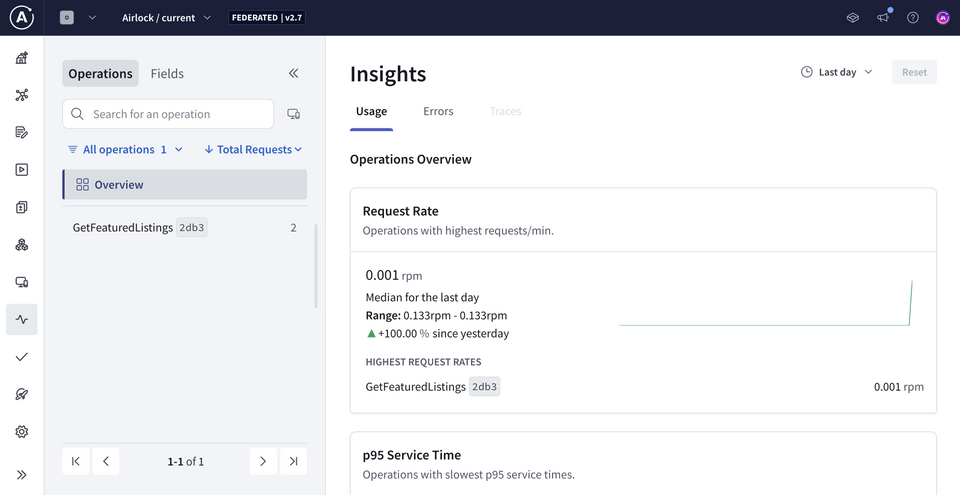
The Operations tab in the first panel on the left gives us an overview of operation request rates, service time, and error percentages, including specific operations for each of these that might be worth drilling deeper into.
We recommend that clients clearly name each GraphQL operation they send to the supergraph, so we can easily view them in our metrics.
We can also filter to select a particular operation to see more specific details about its usage, as well as its signature, which is the shape of the query. We can see the number of requests that have been made and how long each request takes over time.

Field metrics
Next, let's check out field metrics. Head over to the Fields tab.
For each field, we can explore more specific datapoints, including the number of requests that have included it.
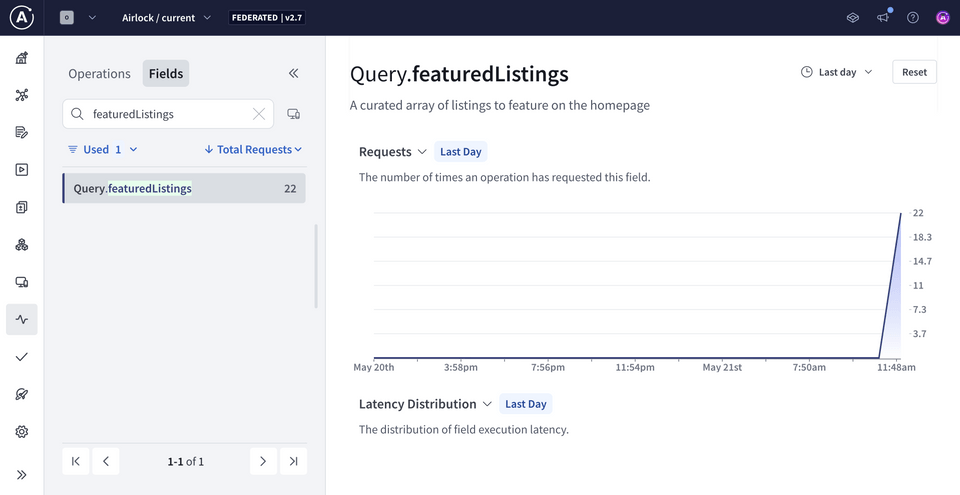
We can use both operation and field metrics to monitor the health and usage of our supergraph's types and fields and determine where we can start to improve, based on how they're performing and how our clients are using them. Because we can see which fields our clients are using and how frequently, these metrics also let us know when it's safe to remove unused fields from our graph.
Practice
Key takeaways
- Operation metrics provide an overview of operation request rates, service time, and error percentages within a given time period or for a specific operation.
- Field metrics include the requesting operations metric, which lists the number of operations in a given period that have included the particular field.
Up next
We've reviewed our metrics, and we're ready for our supergraph to grow. In the next lesson, we'll introduce a whole new domain in the form of a new subgraph, all about reviews!
Share your questions and comments about this lesson
This course is currently in
You'll need a GitHub account to post below. Don't have one? Post in our Odyssey forum instead.
