Overview
Let's forget about combing through long terminal logs—lots of tools make exploring our metrics a lot cleaner.
In this lesson, we will:
- Install and set up Prometheus
- Expose the router's metrics to Prometheus
- Explore data about how our router's running
Prometheus
Let's get into it! To make our router's logs a lot easier to browse, we'll set up Prometheus.
Prometheus is a tool for monitoring system output and metrics, primarily intended for use in a containerized environment with many different services running simultaneously. Even though our router isn't running in a container, we'll still benefit from hooking Prometheus up to its metrics. Prometheus has numerous features that are worth exploring, but we'll keep our use case fairly straightforward for this course: we want to be able to visualize our router's metrics and inspect them in a cleaner, more organized format than verbose terminal logs.
Prometheus also works great with Grafana, though we won't cover their integration in this course.
To set up Prometheus, navigate to the official download page. Here you'll find a variety of download options depending on your operating system and architecture. Use the dropdowns to find the right match for your computer, then click download on the provided tar.gz file!
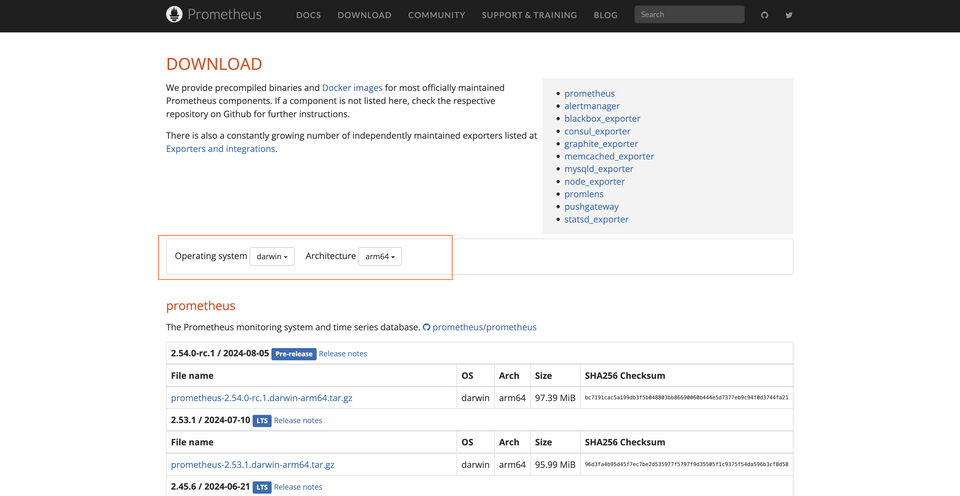
When you expand the downloaded package, you'll find a bunch of different items contained in it. Among them are two files in particular that we'll concern ourselves with: the prometheus binary, and a configuration file called prometheus.yml.
📦 prometheus┣ 📂 console_libraries┣ 📂 consoles┣ 📂 data┣ 📄 prometheus┣ 📄 prometheus.yml┗ 📄 promtool
We'll run the prometheus binary, and use the prometheus.yml file to set our configuration, but first let's make sure our router's exposing its metrics.
Exporting metrics to Prometheus
Jump into router-config.yml. We need to set some configuration that will allow the router to expose its metrics on a specific port. Then, we'll make sure that Prometheus is listening for the logs on this port.
Locate the telemetry key.
# ... supergraph configurationinclude_subgraph_errors:all: truetelemetry:instrumentation: # ... other config
We'll define three additional keys, each nested beneath the key that precedes it: exporters, metrics, and prometheus. Here's what that looks like.
telemetry:exporters:metrics:prometheus:instrumentation: # ... other config
Under the prometheus key is where we'll provide our actual configuration. We'll tell the router that yes, exporting metrics to Prometheus is enabled. We'll give it the host and port to listen on, followed by the path where metrics can be found on that port. We'll listen on host and port 127.0.0.1:9080, with a path of /metrics. (This is the default path Prometheus looks for on the given host!)
telemetry:exporters:metrics:prometheus:enabled: truelisten: 127.0.0.1:9080path: /metrics
That's it for our router configuration! Let's stop and restart our router now.
Now open up http://127.0.0.1:9080/metrics in the browser. If everything worked correctly, we'll see a bunch of output from the router.
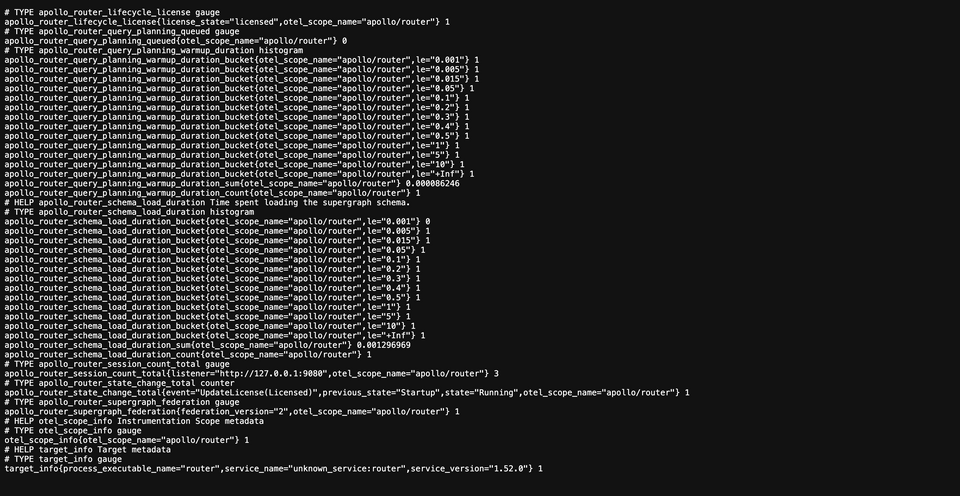
Great, now let's boot up Prometheus.
Setting targets in Prometheus
We can use the Prometheus configuration file to do something similar: we'll give it a target to scrape data from, namely the port where our router is exporting its metrics to. Open up the prometheus.yml file included in the Prometheus package we downloaded.
By default, this file is configured to listen to the running Prometheus instance's own metrics. If you scroll down, you'll find a key called scrape_configs.
scrape_configs:- job_name: "prometheus"static_configs:- targets: ["127.0.0.1:9090"]
We're not interested in Prometheus' metrics, so let's first clear out the job_name field and replace it with "router". Then under static_configs, in the targets list, we'll update the port Prometheus should scrape router metrics from to be 9080.
scrape_configs:- job_name: "router"static_configs:- targets: ["127.0.0.1:9080"]
Save the file, and let's start up Prometheus. In a terminal opened to the downloaded Prometheus package, run the following command to start the binary.
./prometheus
As soon as the process is running, we can open the Prometheus client by navigating to http://localhost:9090.
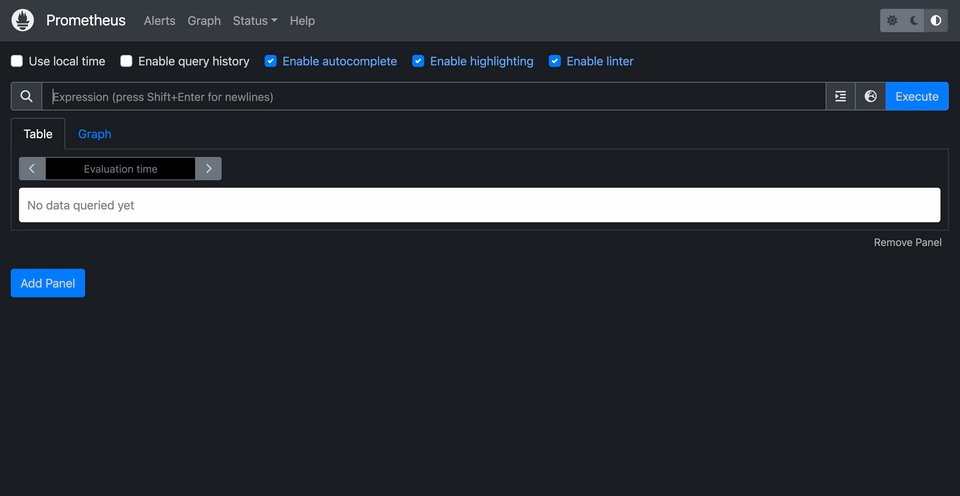
Exploring Prometheus
We can explore any of the router's exported metrics here in Prometheus. In the search bar, type out apollo_. See the long list of options that pop up? Let's keep typing until we find the option apollo_router_cache_hit_time_count. Once it's selected, click the blue Execute button. And we should see...nothing! (For now.)
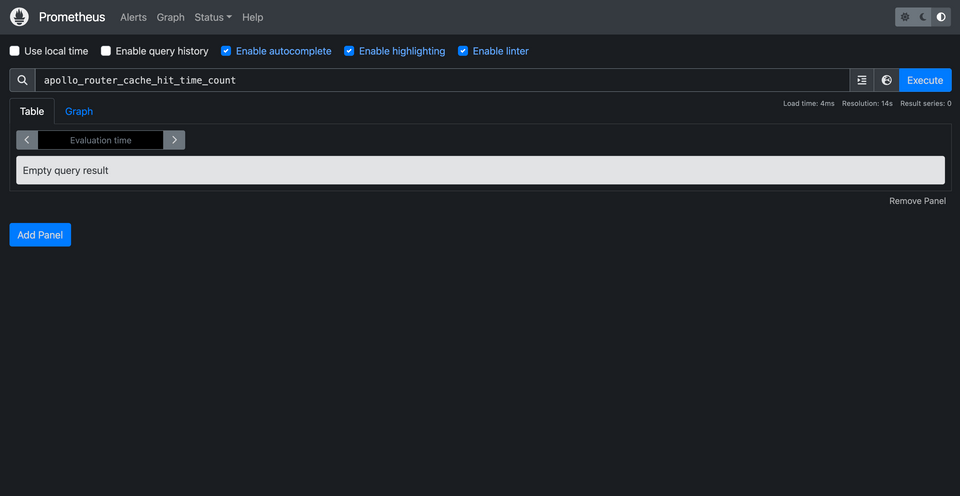
Every time one of our requests utilizes a cache—either the router's in-memory cache, or Redis—we'll see a new entry in Prometheus. Before starting, let's make sure our Redis cache is clear and that our router has been booted up.
Jump into Explorer. We'll start with a query for a particular listing.
query GetListing($listingId: ID!) {listing(id: $listingId) {titlenumOfBedsreviews {rating}}}
And in the Variables panel:
{"listingId": "listing-1"}
This is the first time the rebooted router has received this request: this means that even if we press Execute in Prometheus for our apollo_router_cache_hit_time_count metric again, we won't see any results. The router won't have found it in either cache (hence there are no "cache hits" in either case).
Now run the query again in Explorer. This time we should see a different result in Prometheus.
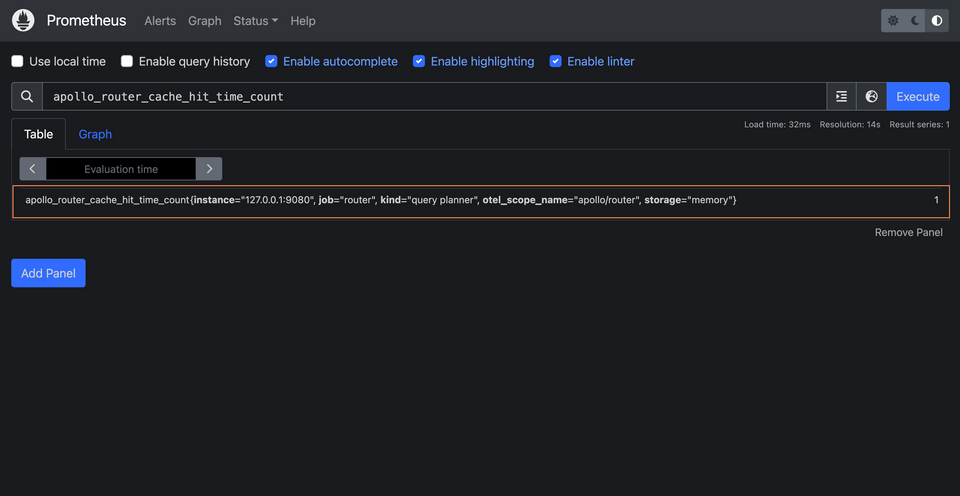
Note: You can press the Execute button to refresh the data on a specific metric panel. If this doesn't result in new data, try refreshing the page.
Here under the Table tab we'll see a new entry; and if we look at the end of the line, we'll see a specific indication about where the router discovered the cached query plan: storage="memory". On the far right we can also see the total count for each time a cache hit has occurred for the in-memory cache; currently, it's just one time.
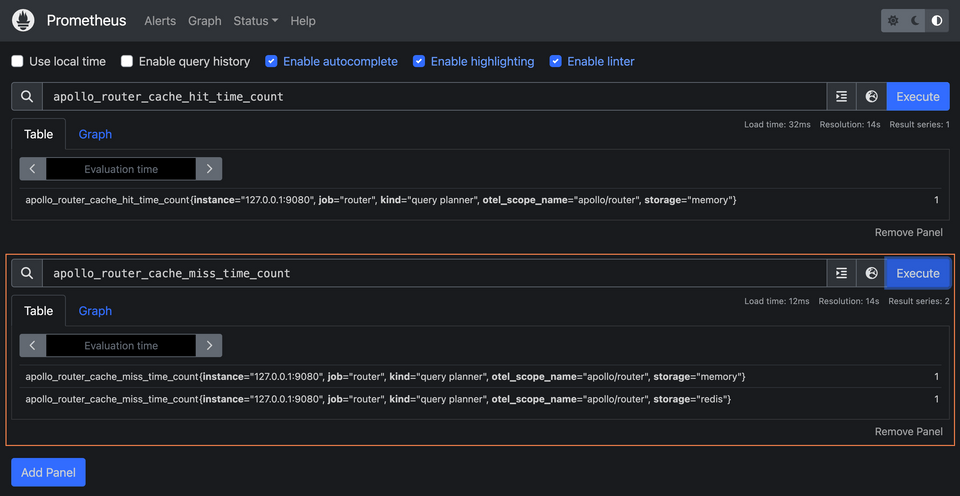
Let's add a new panel. Click the Add panel button, then type apollo_router_cache_miss_time_count into the search bar. Click Execute.
apollo_router_cache_miss_time_count
This new panel collects data about each time the router fails to find a query plan in one of its caches. We should see two lines: one for storage="memory", another for storage="redis". In this case we can see that each cache has a miss count of 1; the router checked both caches the first time we ran our query, but neither had the query plan. The second time we ran the query, the router found the plan in its in-memory cache.
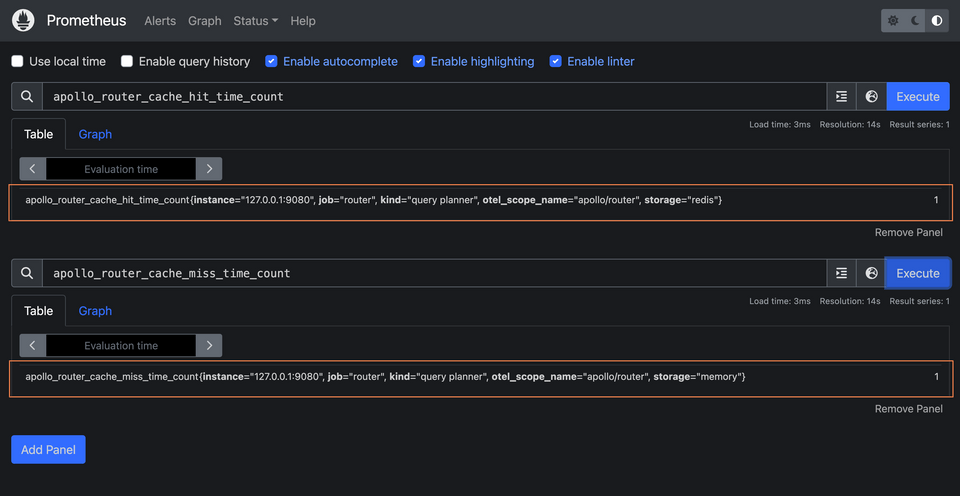
Let's pretend that a different router instance needs to execute the query. To do this, we'll stop our router and restart it. This clears its in-memory cache, simulating a fresh router coming on the scene without any past executed queries.
Back in Explorer, run that query one more time, then refresh the metrics in Prometheus.
Under apollo_router_cache_hit_time_count, we'll see that there was one successful hit when checking our Redis cache. We'll also see that there was a cache miss when our router tried to check its own in-memory cache for the plan. Not finding it, it checked the distributed cache, where any router executing a query can stash its query plan for the benefit of other router instances.
Take some time to explore the other metrics available in the dropdown: explore cache size over time with apollo_router_cache_size, or check out something entirely different like apollo_router_operations_total!
Practice
Drag items from this box to the blanks above
resource
target
exporterstelemetrycachequery results
metrics
redis
Key takeaways
- Prometheus can monitor and record our system output, allowing us to get a fine-grained look at particular metrics.
- To enable the router to export its metrics in a format accessible to Prometheus, we can configure its
telemetrykey to enable a metrics endpoint. - We can use the
prometheus.ymlfile to customize itstargets: the various systems or services it scrapes data from.
Journey's end
You've done it! We've taken the full journey through the router's current caching capabilities: from query plans to APQ, in-memory and distributed, to ending with a dashboard in Prometheus that shows us the finer details of a particular metric. Well done!
Share your questions and comments about this lesson
This course is currently in
You'll need a GitHub account to post below. Don't have one? Post in our Odyssey forum instead.